
Being able to detect new malware infections or security breaches on a network or on a computer system without known signatures is always a challenge. We explore a simple and efficient solution to monitor external facing assets, such as servers, and we discuss the data that was collected during the experimental period.
In this experiment, Nettitude deployed an Internet facing Windows 2012 server that was configured for monitoring. During June 2017, over 5 million events were collected. Nettitude will explain the setup process and discuss the data collected that will ultimately lead towards a better monitoring system.
How to set up a monitoring system
In order to begin monitoring a computer system, several component parts are required. Firstly, a system or device needs to be identified that is going to be monitored. Next, a server is required that performs the monitoring where all the accumulated information is stored and finally a server to correlate and display the information in a way that can be of use to an analyst.
Our system architecture has several interconnected software components. A simplistic overview of this concept consists of a windows machine for the target, sysmon (System Monitor) for the logging of events and ELK (Elasticsearch, Logstash, Kibana) to perform the data analysis on events captured, as seen in Figure 1.
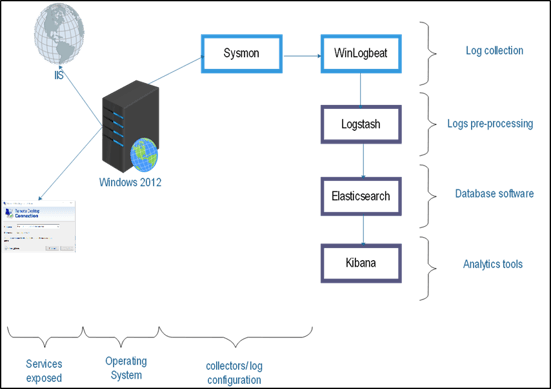
Figure 1: Functional system architecture.
These systems, when combined, provide a powerful tool for monitoring and to some extent, threat hunting. Provided you have a windows licence or means of using a windows server then you will be in a position to setup up such a system. Sysmon and ELK are free to use software products that are readily available.
Windows server
In this scenario, we take the case of a company hosting their web server online on a dedicated Virtual Private Server (VPS). We set-up an IIS server as the web server in which the application/website will be deployed. Nettitude then created remote access through Remote Desktop Protocol (RDP) to remotely log in and manage the server. We had two ports open: RDP 3389 and IIS 80. We deployed a Windows Server 2012 in 64-bit.
Two applications were installed on the Windows Server. Sysmon to collect the logs from the operating system and Winlogbeat that collects data from Windows logs and subsequently pushes them to our second server that will process the logs before storing them in Elasticsearch. The logs collected by Sysmon are pushed to the Windows log management system and viewable in event viewer.
Sysmon
Nettitude used Sysmon version 6.03 for this experiment. We strongly recommend taking time to understand how sysmon works and what it can record. Nettitude has previously released blogs on how to configure sysmon. In this case, we monitored the ports that were open. In the sysmon config, we added configuration options that would allow networking transactions to be monitored without the need to record the network traffic, as seen in Figure 2.
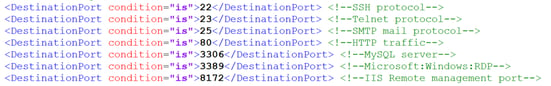
Figure 2: List of ports to monitor
Microsoft gives an extensive list of processes to monitor. In our experiment, the top processes that were triggered during our observation period can be seen below in Table 1.
|
Event ID’s to monitor |
Event ID details |
|
4,625 |
Account login failed |
|
4,624 |
Account login successful |
|
4,672 |
Special privileges assigned to new logon |
|
4,907 |
Auditing settings on object were changed |
|
5,186 |
IIS Application Pool Recycling |
|
4,634 |
An account was logged off |
|
4,648 |
A logon was attempted using explicit credentials |
|
7,040 |
status information about services |
Table 1: Windows Event ID's
Besides the processes related to login activities, there are other processes that are very important for instance process id = 4612, detailed in Figure 3.
![]()
Figure 3: ID 4612.
Winlogbeat
In order to get the windows event logs from the windows server to logstash, winlogbeat is used. Winlogbeat supports windows operating systems back to XP and is available from the elastic website. Configuring winlogbeat can be tricky at first if you are unfamiliar with the software. Once installed, open the winlogbeat.yml file to decide which event logs you want to monitor. By default, the file will contain application, security and system configurations. Figure 4 shows the current configuration of the winlogbeat.yml file that Nettitude had in place. Note, under the heading “Logstash output” next to “hosts” in square brackets should be your logstash IP address and port number separated by a coma.
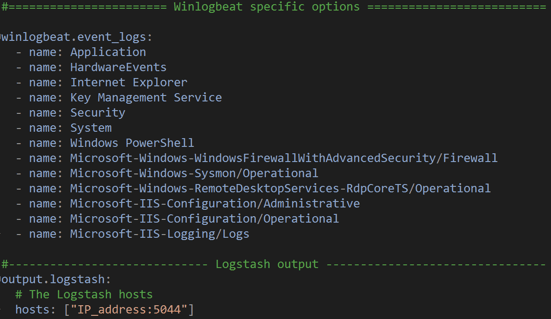
Figure 4: A custom configuration of winlogbeat.
The “– name:” parameter in the file is the “Full Name” of the log as recognised by Windows OS as shown in Figure 5.
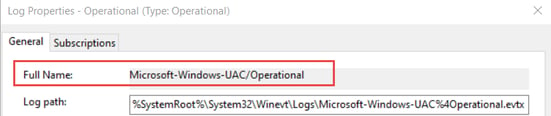
Figure 5: Configuration option for Winlogbeat
ELK Overview
ELK stands for Elasticsearch Logstash and Kibana. The use of these tools is free and open source which makes for an excellent platform from which a monitoring system can be established. The ELK software, introduction and setup can be found under the elastic website. For this setup two VPS servers were used. One for Logstash on its own and one for Elastic Search and Kibana. ELK was separated over two servers to reduce the load. In general, Kibana commands few resources while Logstash tends to be more CPU intensive and Elastic Search is more RAM intensive.
How to configure Logstash
After installing logstash the next procedure is to setup the input, filter and output configuration file. Winlogbeat has the ability to send logs straight to Elasticsearch without the need for logstash if no filtering is needed. In this setup logstash was used without filtering as this will be added at a later stage. Figure 6 shows the input and output fields that were used. The location of the logstash configuration file should go in “/etc/logstash/conf.d/”. Once configured logstash is a service and can be started as such using the following command variants i.e. “service logstash start/status/stop/restart”.
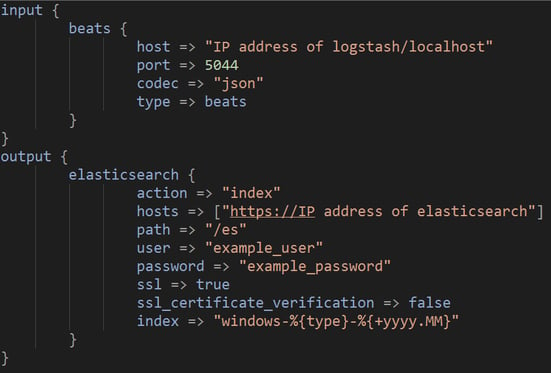
Figure 6: Input and output configuration for the Logstash server
Input field
Host: The IP address of the logstash server.
Port: The port winlogbeat sends its logs to.
Codec: The format the logs are sent in.
Type: The type of log.
Note: The input fields details should line up with the details of the winlogbeat file.
Output field
Action: logs are to be indexed.
Hosts: IP address of the Elastic Search server.
Path: URL path to the Elasticsearch instance.
User: Username for the server.
Password: Password for the server.
SSL: Turned to on.
SSL certificate verification: Whether to verify the Elasticsearch certificate.
Index: the name of the index to use.
Elastic Search
As seen in Figure 1, Elasticsearch is the database software used to hold all of the logs that are collected by Logstash. Elasticsearch provides a distributed full-text search engine. A default installation of Elasticsearch was used. One crucial point to note on the use of Elasticsearch is to restrict the outside access to your Elasticsearch instance. This can be achieved in Ubuntu by using the command line utility “ufw”, or by modifying the configuration in “/etc/elasticsearch/elasticsearch.yml”. By default, users can read data and shut down your Elasticsearch cluster.
Kibana
Kibana provides the analysis tool for this system. With this tool, a user is able to setup their own dashboard to analyse specific data they require. The only configuration changed in Kibana was the “server.host:” which was changed from 0.0.0.0 to localhost for this specific setup.
Stay tuned for part 2 of this article! To receive an alert when new blogs are published on the Nettitude blog, become a blog subscriber for free today.


